

Reporting automation creates value when an organisation moves beyond producing more reports and starts making decisions faster. Auchan’s case study describes the journey from 14 scattered data sources and reports taking up to three days to prepare to a shared analytics environment, business self-service and two measurable process improvements.
This article is based on a presentation by Witold Kulpiński, Controlling Director at Auchan, during Lean TWI Summit 2026 (2026 event, in Polish) in Wrocław. The project was delivered with support from NewDataLabS. Its focus was changing how users receive data, ask questions and move from analysis to action, rather than simply deploying Tableau.
Reporting automation at Auchan: the starting point
The organisation’s scale made data a significant operational issue. According to the figures presented for 2025, Auchan Polska operated in all 16 Polish voivodeships, employed approximately 14,000 colleagues, generated PLN 13 billion in net turnover and ran 264 outlets in various formats. The company has operated in Poland since 1996.
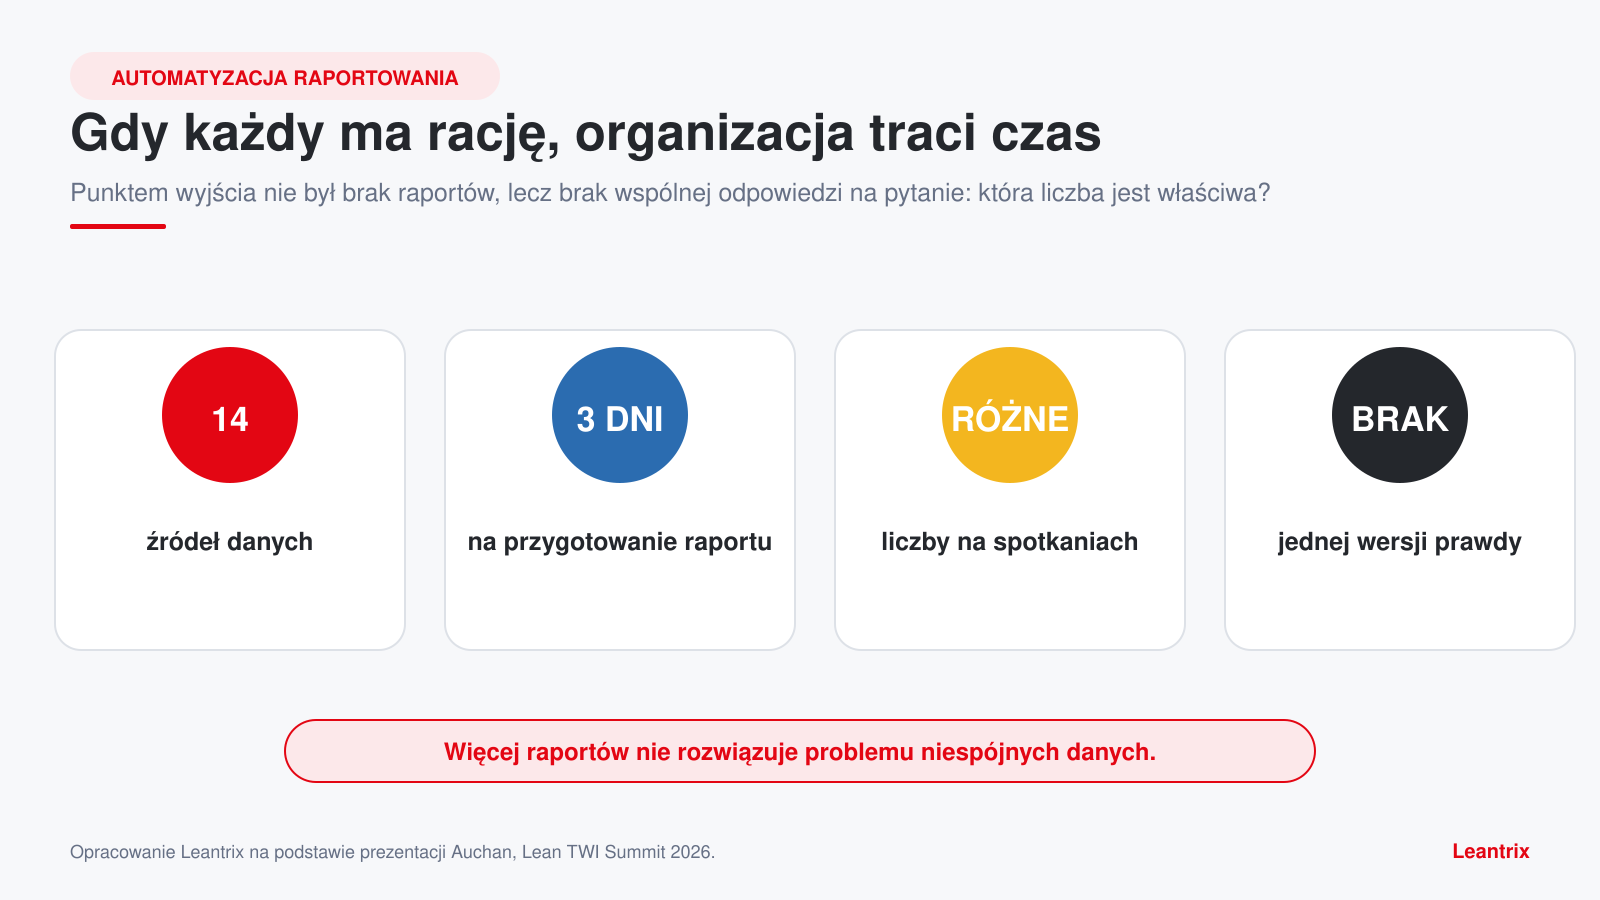
In this environment, a single commercial decision can involve controlling, purchasing, sales, partners and suppliers. The presentation illustrated the problem through a Monday meeting: controlling presents one figure, purchasing another, and both teams can justify their numbers. The disagreement does not reflect a lack of competence. Each team uses a different source, scope or refresh time.
The starting point was 14 scattered data sources, manual reporting taking up to three days, different numbers at different meetings and no unambiguous answer about which version was correct. More reports did not solve the problem; they increased the number of competing versions of reality.
From reporting to business decisions
Traditional reporting often ends when the file is sent. A user receives a table or slide, but the next question requires contacting an analyst again. The cycle restarts: extracting data, agreeing the scope, recalculating, checking and distributing another version.
We were not implementing dashboards—we were implementing a way of making decisions.
This statement from the presentation captures the change in objective. The dashboard was not intended as an attractive endpoint of the reporting process. It was meant to let users answer the next question independently, drill down, compare options and test a hypothesis without waiting for a new report. Value came from decisions based on data, rather than from the chart itself.
The capabilities the organisation needed
The team did not start with a list of Tableau functions. It first defined the capabilities the business needed:
- Answering business questions independently without commissioning a new report every time.
- Interactivity and drill-down, enabling users to move from the overall picture to the cause of a deviation.
- Connecting scattered data through a shared model and definitions.
- Scaling the solution without a proportionate increase in people’s workload.
- Testing hypotheses quickly during or immediately after a meeting.
- Support from an implementation partner combining technical expertise with an understanding of business needs.
This approach prevents a common mistake: purchasing a platform without clearly defining the behaviours it should change. Technology becomes a means of building capability rather than the project’s goal.
Reporting automation: the data transformation architecture
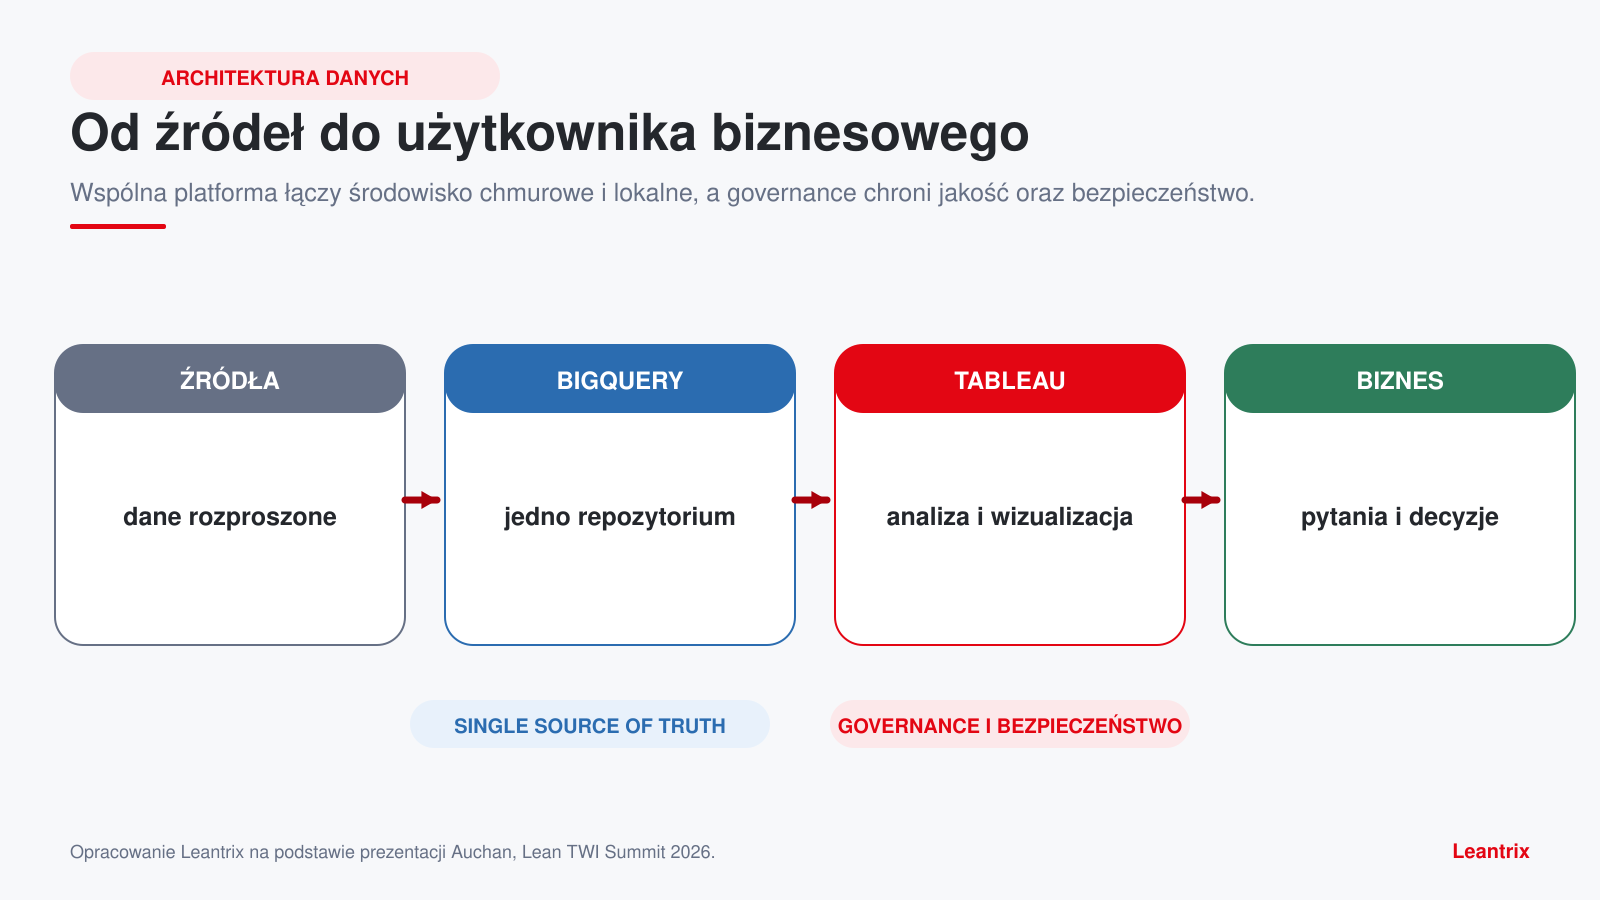
The target flow comprised four layers: data sources, BigQuery, Tableau and business users. The solution combined cloud and on-premises environments. Its central principle was a single source of truth, supported by governance and data security.
A single source of truth does not mean one enormous file. It means shared definitions, processing rules, accountability for quality and controlled information access. Controlling, purchasing and other functions can then discuss what a result means rather than which spreadsheet it came from.
Reporting automation and five sources of business value
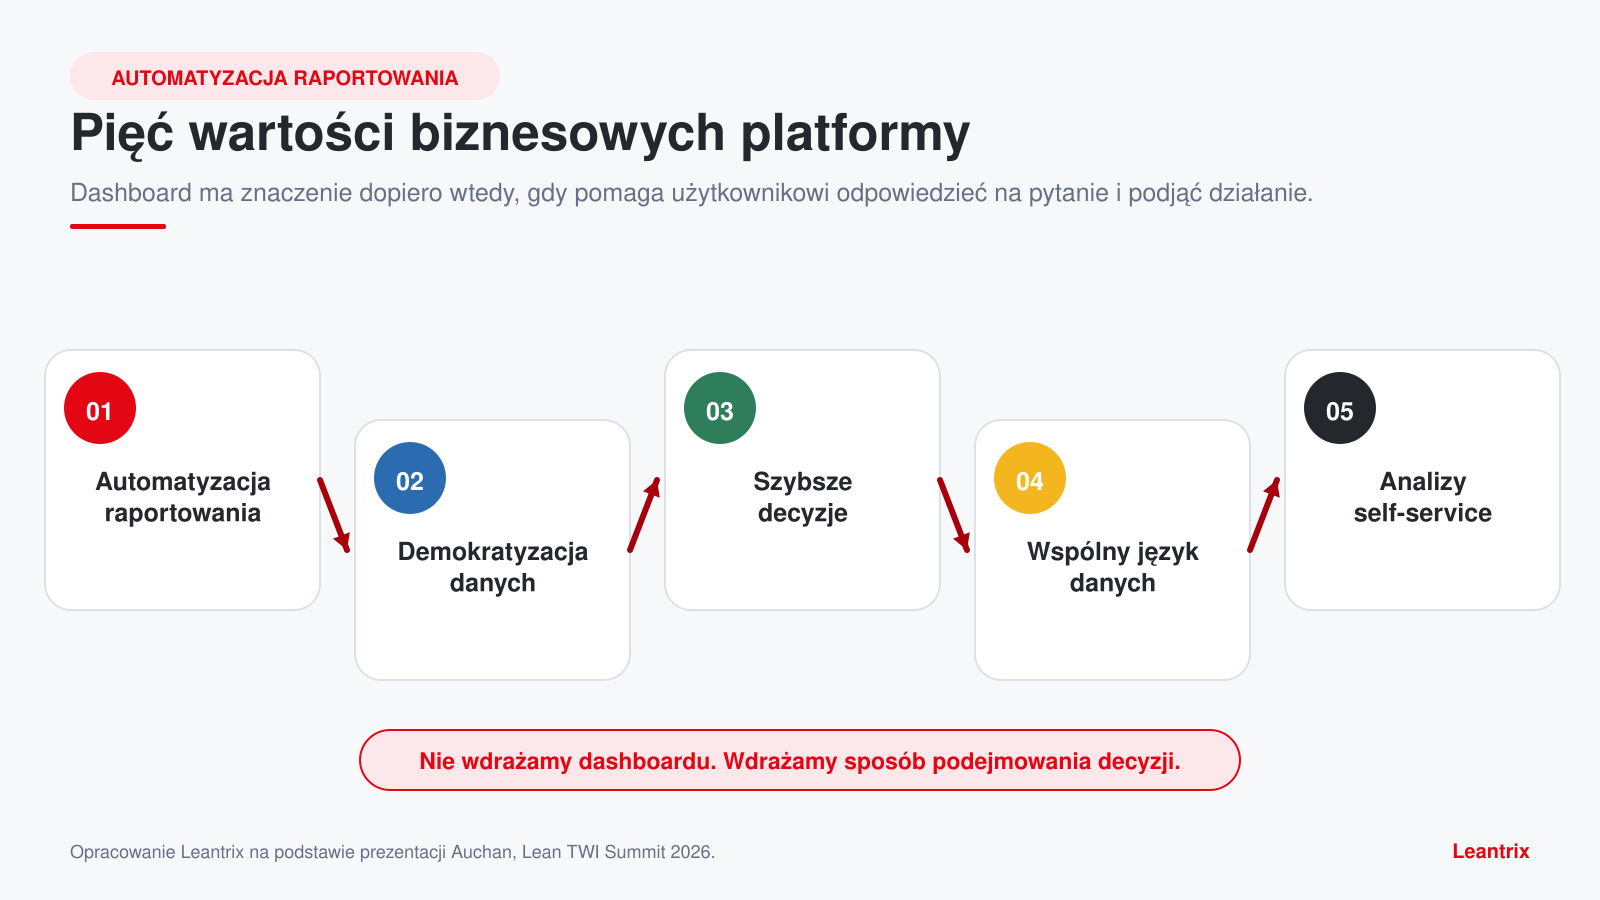
Auchan’s presentation identified five areas of value. Together, they show that the transformation went beyond saving analysts’ time.
- Reporting automation. Repeated data extraction, integration and refreshing no longer consume the team’s time.
- Data democratisation. Information reaches a broader group of users in a controlled way.
- Faster decision-making. Users no longer wait several days for the next version of a report.
- A shared data language. Meetings begin with the same figures and definitions.
- Self-service analytics. Business users can perform their own analyses and drill down without rebuilding a report from scratch.
In this approach, reporting automation frees up time, but its full effect appears when it changes management routines. Users see deviations sooner, investigate causes independently and act within the same decision cycle.
Adoption and change management
Business engagement catalysed the change but did not remove resistance. This included resistance from owners of earlier processes and tools. That is natural: a new solution changes roles, accountability and perceptions of previous work, as well as the screen.
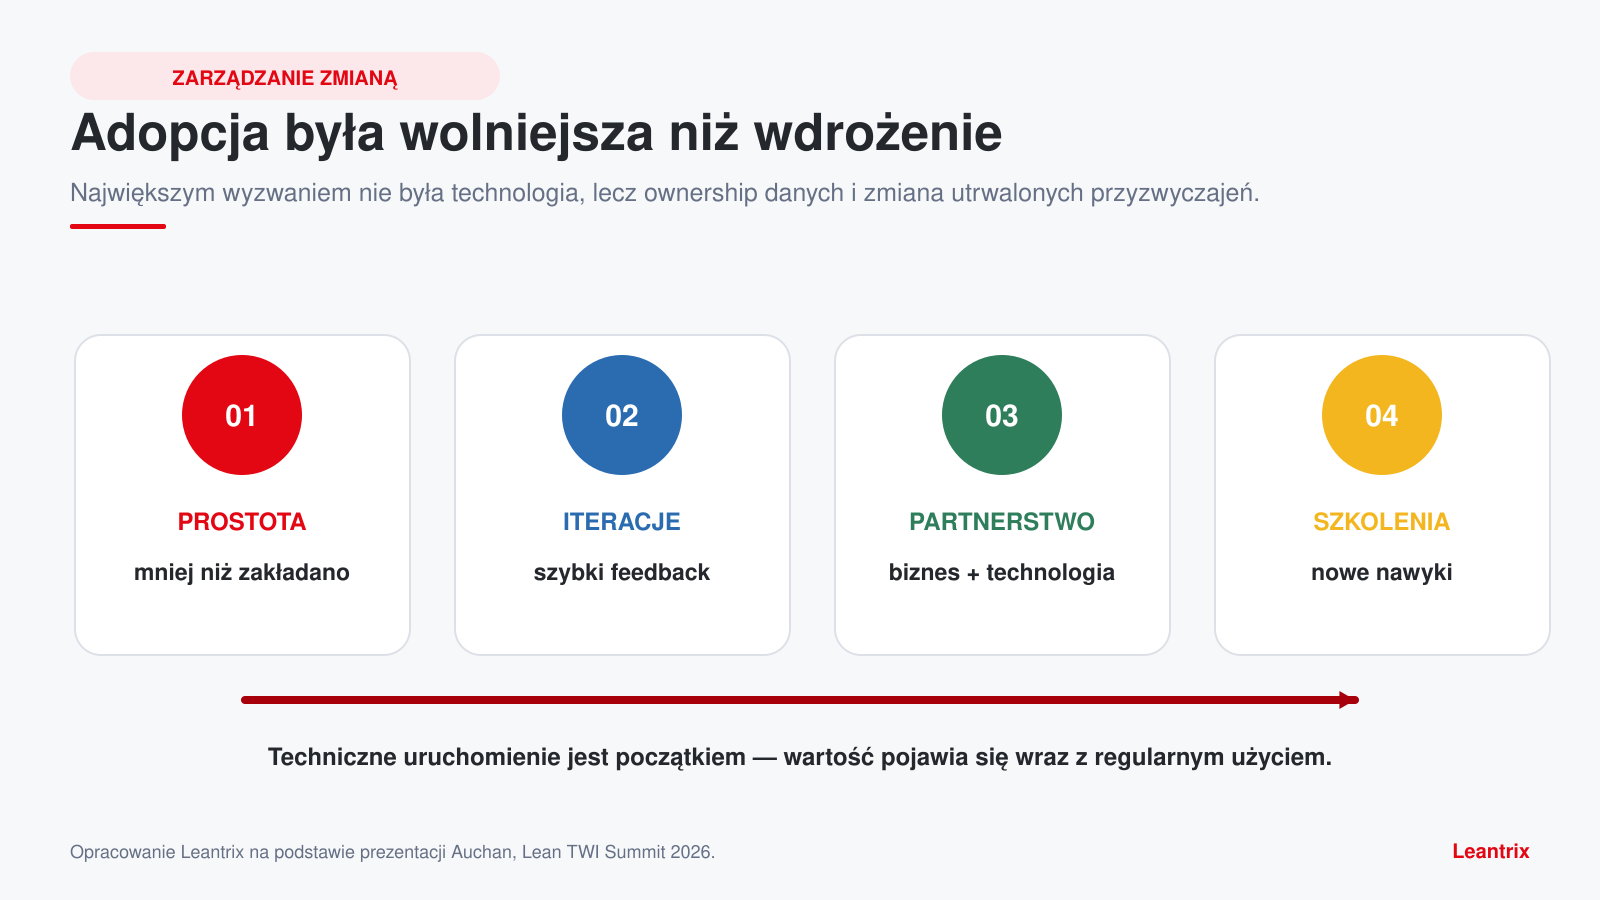
Auchan encouraged adoption by demonstrating dashboard simplicity, rapid iterations and drill-down, alongside its technology partnership and user training. Simplicity proved particularly important. Users wanted less elaborate dashboards than originally anticipated. They needed a clear answer and a next step rather than the maximum possible number of visualisations.
What surprised the team
- Data ownership, rather than technology, was the biggest challenge.
- Changing habits was harder than building the solution.
- Adoption progressed more slowly than technical implementation.
- Simpler dashboards better matched users’ actual needs.
This lesson applies to every BI project: platform launch does not mark the end of transformation. The system starts creating value when people use it regularly in meetings, make decisions with it and abandon parallel, private versions of reports.
Use case 1: sharing data with suppliers
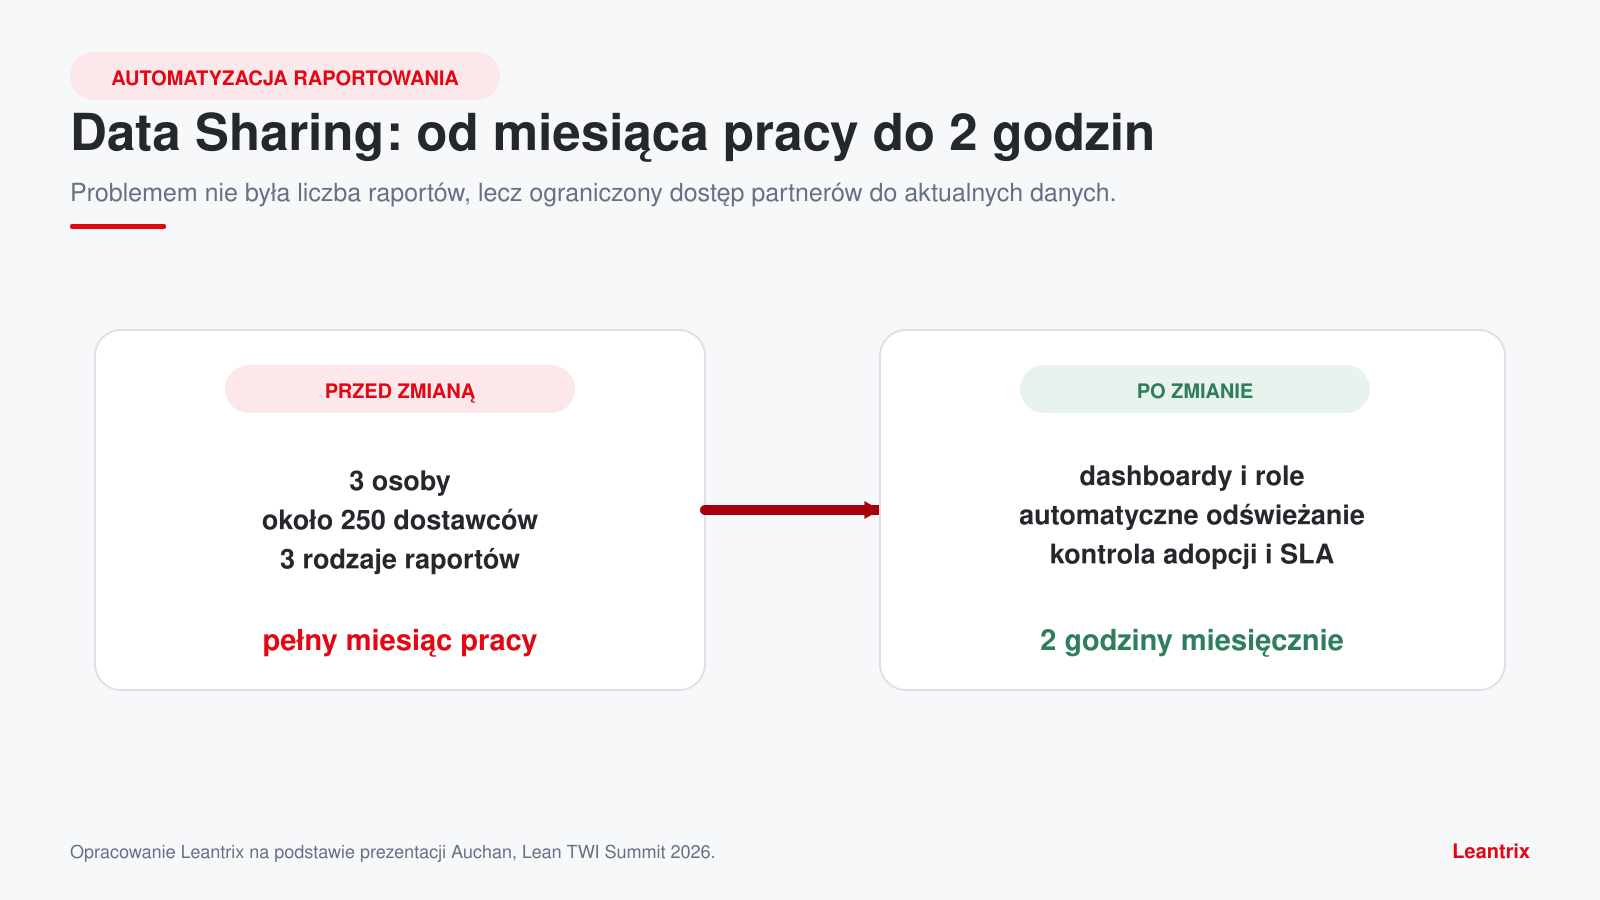
The first example concerned partners’ access to data. Initially, three people supported approximately 250 suppliers and three types of reports, with the tasks consuming a full month’s work in total. The team might initially have treated this as a need for more reports. Analysis showed that access was the real constraint.
The solution introduced dashboards, roles and automatic refreshing. Measurement covered adoption, report numbers and SLA. Planned next steps included personalisation and predictive analytics. The reported result was two hours per month spent configuring access.
The problem was not the reports. It was how users gained access to current data.
Use case 2: a digital commercial-contract process
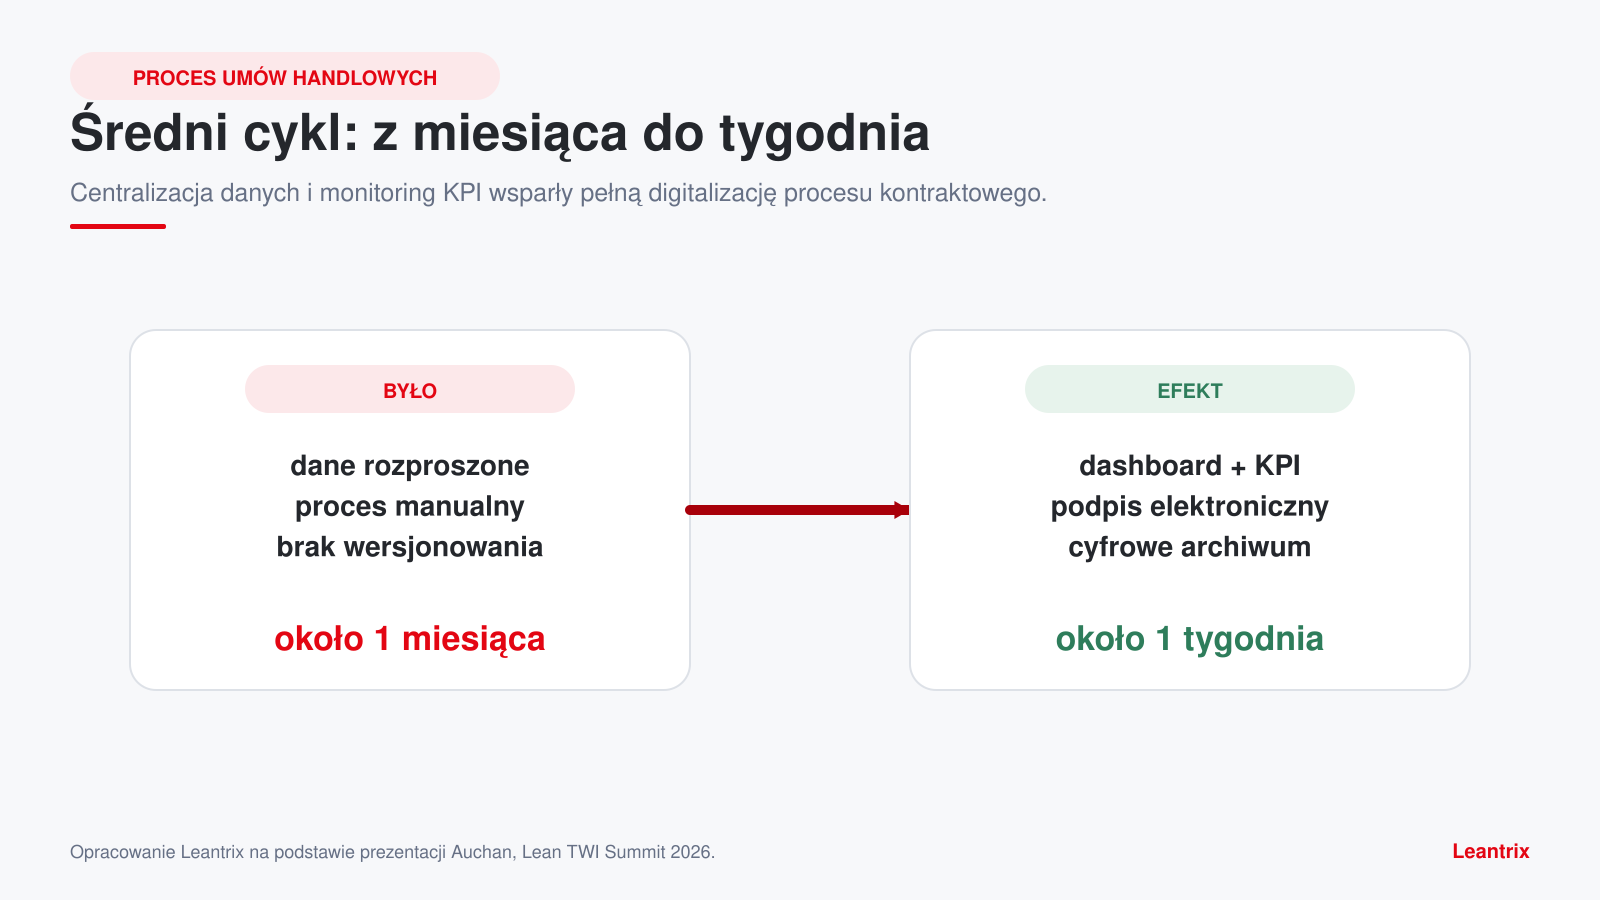
The second example concerned commercial contracts. Contract data was scattered, the process was manual and contract versioning did not provide full transparency. The average contract cycle took approximately one month. This lengthy flow restricted oversight and affected the accuracy of supplier settlements.
The goal became centralising data and monitoring process execution. The team built a contract dashboard and KPIs, then monitored solution usage, cycle time and process coverage. Further development plans included alerts, workflow and risk forecasting.
The result was a fully digital flow: from preparing the contract package through electronic signing to document archiving. The organisation gained fuller process control, and the average contract cycle fell from approximately one month to approximately one week.
Reporting automation: two examples
| Area | Initial state | Change | Reported result |
|---|---|---|---|
| Data Sharing | limited access, approximately 250 suppliers, a full month’s work | dashboards, roles and automatic refreshing | 2 hours per month spent configuring access |
| Commercial contracts | scattered data, a manual process, an average of 1 month | centralisation, a KPI dashboard, electronic signing and archiving | a fully digital process and an average cycle of approximately 1 week |
The two cases started with different symptoms but followed the same logic. The team first defined the process problem, then clarified access and data ownership, built the solution, established adoption measures and planned the next improvement cycle.
What reporting automation really requires
Reporting automation involves more than connecting sources and scheduling refreshes. To make it sustainable, an organisation must establish data owners, KPI definitions, access rules, expected decision routines and accountability for responding to deviations.
- Data ownership: clear responsibility for definitions, quality and changes to the source.
- Unambiguous KPIs: users understand the numerator, denominator, scope and refresh frequency.
- Roles and permissions: access is broad enough while respecting security requirements.
- Decision-making process: the dashboard is linked to a specific meeting, question and action.
- Adoption: the organisation measures usage rather than only published report numbers.
- Retiring old tools: parallel spreadsheets do not maintain alternative versions of the truth.
Reporting automation: an implementation plan
- Choose a decision rather than a dashboard. Define the business question and the person who should act on the answer.
- Map sources and differences in definitions. Establish where conflicting values originate and which rule will become the standard.
- Assign a data owner. Technology alone cannot resolve accountability between functions.
- Build a minimal view. Start with the information needed for a decision, then add layers in response to users’ questions.
- Test within actual working routines. Use the solution during meetings and observe where users still return to spreadsheets.
- Measure adoption and process results. Connect active-user numbers with cycle time, SLA or labour savings.
- Develop the solution iteratively. Personalisation, alerts and predictive analytics should follow once the foundations are stable.
How to measure value after implementation
| Level | Example measure | Review question |
|---|---|---|
| Technology | refresh time, availability and data-feed errors | Does the platform provide current data? |
| Adoption | active users, usage frequency and use of drill-down | Does the business actually use the solution? |
| Process | report preparation time, contract cycle or access administration | Has the flow become faster and simpler? |
| Decision | time from question to action and disputes about definitions | Does the organisation make decisions more effectively? |
| Business outcome | SLA, settlement accuracy, labour cost and risk | Has the change improved the outcome as well as the report? |
A usage indicator alone is insufficient. A dashboard can be opened frequently without changing how people act. Auchan therefore combined adoption measures with process measures: report numbers, SLA, cycle time and coverage.
Common risks in data transformation
- Moving chaos into a new tool. Inconsistent definitions remain inconsistent even on a shared dashboard.
- An overly elaborate initial view. Users cannot tell which information requires action.
- No data owner. Every discrepancy becomes an argument between teams.
- Measuring only technical implementation. The project is declared complete while adoption is only beginning.
- Parallel reporting. Old spreadsheets preserve competing versions of the figures and undermine trust.
- Automation without decisions. The organisation receives reports sooner but still lacks a response rule.
Reporting automation: lessons from Auchan
The main lesson is to shift the focus from reports to decisions. A single source of truth accelerates an organisation, but only when users trust the definitions, understand accountability and can move independently from a result to its cause.
Tableau served as a business-transformation platform, but the hardest part of the project was not the data itself. It concerned people, ownership, simplicity and changing habits. This is why reporting automation should be managed simultaneously as a data, process and change-management project.
Auchan’s broader digitalisation direction is also described by its official press office (in Polish). The implementation partner in this case study, NewDataLabS, presents reporting automation as one area of its Data, AI and CRM solutions.
FAQ: reporting automation in practice
Is a dashboard enough to speed up decisions?
No. Shared definitions, data owners, appropriate permissions, working routines and clear accountability for action are also needed. A dashboard simply makes information easier to access.
Why can adoption be slower than implementation?
Technology launch can be planned as a project. Changing habits requires repetition, user support, retiring old tools and confidence in the reliability of the new data.
What does “single source of truth” mean?
It is an agreed data model, KPI definitions and processing rules used by different functions. It does not mean all information must physically originate in one system.
Where is the best place to start reporting automation?
Start with an important, recurring decision where the organisation loses time preparing data or reconciling numbers. The first scope should be small enough to test quickly, yet important enough for users to want to use it.
About the reporting automation case study presenter
Witold “Witek” Kulpiński is Controlling Director at Auchan Retail. He works across controlling, finance, purchasing, retail and operations, developing the use of data in business management. At Lean TWI Summit 2026, he presented the transformation from manual reporting to a shared analytics platform, alongside practical examples of supplier data sharing and digitalisation of the commercial-contract process.
This article is based on materials presented by Auchan at Lean TWI Summit 2026 in Wrocław. NewDataLabS was the implementation’s technology partner. The graphics are original, simplified illustrations by Leantrix; they do not reproduce system screens or commercial documents.