Value Stream Mapping (VSM), also known as a VSM Map, is a powerful visual technique used to illustrate, analyze, and improve the flow of materials and information across any process. It originates from Lean methodology and is designed to help teams understand how value moves through their operations — and where it doesn’t.
At its core, VSM answers the question: What is Value Stream Mapping?
It’s a visual representation of the steps involved in delivering a product or service, highlighting both value-adding and non-value-adding activities.
With a properly created Value Stream Mapping diagram, teams can quickly identify inefficiencies, waste, delays, and imbalances. This clarity forms the foundation for continuous improvement and Lean transformation.
Where Did Value Stream Mapping Come From?
Although the concept of process mapping dates back to early industrial engineering, the structured approach we know as Lean Value Stream Mapping grew out of the Toyota Production System. Toyota engineers like Taiichi Ohno and Shigeo Shingo began visualizing process flows in the 1980s to enhance material and information control.
The practice gained global traction through Mike Rother and John Shook’s 1999 book Learning to See. Since then, VSM has become an essential tool not just in manufacturing, but also in industries like healthcare, logistics, software development, and service delivery.
Why Use Lean Value Stream Mapping?
The main purpose of VSM is to eliminate waste (known as muda in Lean terminology) and boost customer value by streamlining the process flow. This includes identifying:
Delays and bottlenecks
Inventory pile-ups
Redundant steps
Underutilized resources
Communication gaps
By mapping both the material and information flow, teams gain a holistic view of how work is done and where improvements can be made.
The 8 Wastes You Can Spot with a VSM Map
Overproduction – Making more than needed or before it’s required
Waiting – Delays caused by idle time
Transportation – Unnecessary movement of items
Overprocessing – Doing more work than required
Inventory – Excess materials or products
Motion – Unneeded movement by people
Defects – Errors or mistakes
Underused talent – Failing to tap into team members’ skills
Mapping the current state makes it possible to detect and eliminate these wastes methodically.
Common Value Stream Mapping Symbols
To build a VSM Map, standard symbols are used. These symbols are consistent across Lean practices and make maps easy to interpret across teams and industries.
| Symbol | Description |
|---|---|
| 📦 Process Box | Represents a specific step or process. Data like cycle time, changeover, and uptime is typically included. |
| 🏢 Supplier / Customer | Depicted as buildings or factories – the beginning and end of the value stream. |
| 🔻 Inventory | A triangle shape showing waiting stock or buffer between steps. |
| 🚛 Transportation | Movement of materials, often represented by a truck icon. |
| ➡️ Push Arrow | Thick arrow showing uncontrolled flow (non-Lean behavior). |
| 🗃️ Supermarket | Controlled inventory between pull processes. |
| 📋 Kanban | A visual signal or card used to trigger replenishment. |
| 📡 Information Flow | Dashed lines connecting processes and systems, showing how orders and signals travel. |
| 🧑🏭 Operator | Human involvement in a step, often with counts. |
| 💡 Kaizen Burst and Job Methods | Highlights areas ripe for improvement. |
Creating the Current-State VSM Map
The Current-State Map is a snapshot of how your process runs today. It doesn’t reflect ideal conditions — only what’s actually happening now.
How to Build a Current-State VSM
Choose a product or service stream
Start with the customer – Document their demand and takt time
Work backward through each process step
Collect real data – cycle time, inventory, waiting times, operator involvement
Draw the process flow using VSM symbols
Map information flow – orders, ERP, signals
Add inventory icons where items wait
Draw a timeline below the map to separate value-adding and non-value-adding time
This visual layout reveals inefficiencies clearly — whether it’s too much inventory, long wait times, or disorganized scheduling.
Designing the Future State VSM Map
Once the current situation is mapped and understood, it’s time to design the Future State VSM — a visual blueprint of how the process should work in its improved form.
This version eliminates waste, balances workloads, and aligns with Lean principles.
Questions to Guide Your Future State VSM
Can we enable continuous flow between steps?
Where can pull systems be introduced?
What inventory buffers can be eliminated or reduced?
Can we combine or eliminate steps that don’t add value?
Are processes aligned with customer demand and takt time?
Common Lean Tactics in Future State VSM
Smaller batches and reduced changeover (SMED)
Balanced workflows (Heijunka)
Implementation of Kanban systems
Process simplification
Enhanced layout and ergonomics (5S)
The Future State VSM becomes a strategic plan for Kaizen initiatives — assigning responsibilities and deadlines to each improvement.
Work Standardization: The Bridge Between VSM and Daily Operations
To make process improvements stick, standardized work must follow. This means clearly documenting the best way to perform tasks and training everyone to follow it consistently.
This approach ties directly into TWI Job Instruction methods — structured teaching for front-line staff. Standardization ensures that your Future State isn’t temporary but becomes the new norm.
Real-World Value Stream Mapping Examples
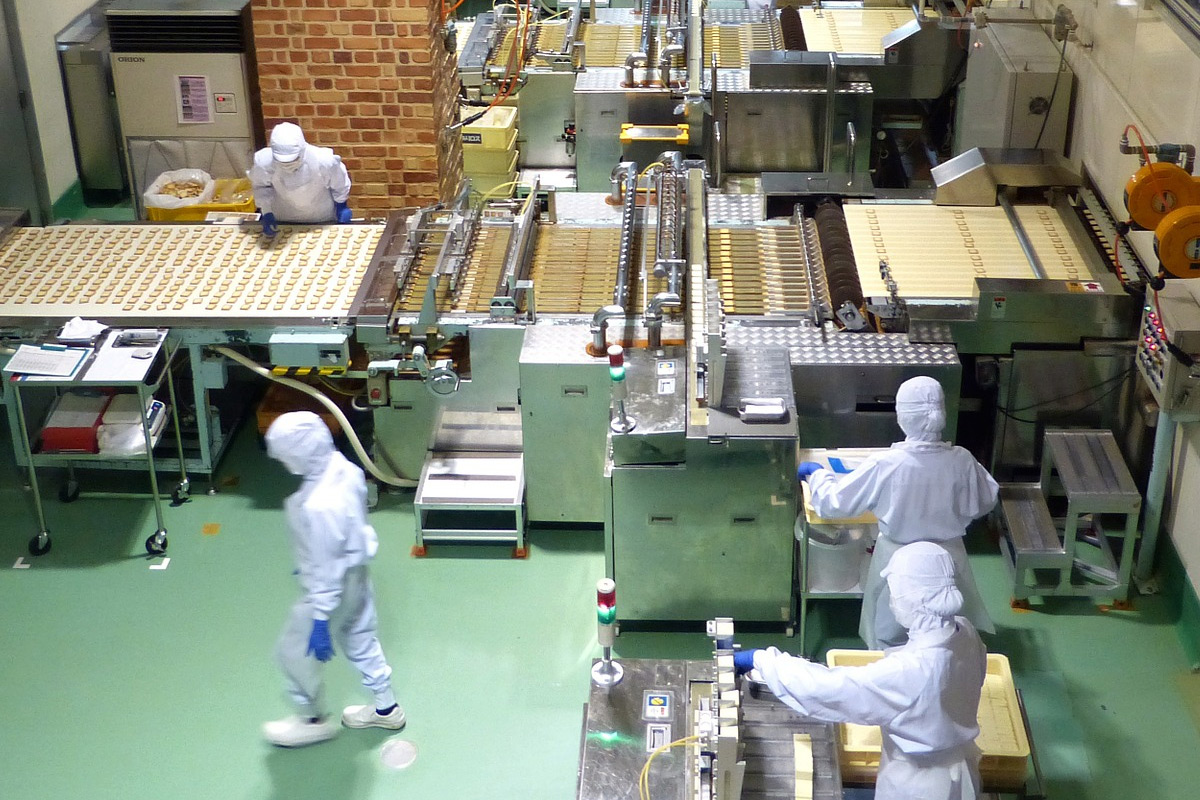
Manufacturing
A packaging company discovered their production time was only 2 days, but customer orders took 3 weeks. The remaining time was spent waiting in queues or searching for materials.
They used a VSM Map to expose this and redesigned the process with flow cells and visual scheduling — reducing lead time by 60%.
Logistics and Warehousing
In a warehouse setting, Value Stream Mapping showed that most time was lost during picking and staging. By reconfiguring the floor layout and introducing pull zones, the operation improved throughput and accuracy significantly.
Office and Administration
An HR department mapped its employee onboarding process. The VSM revealed unnecessary approvals and communication delays. Streamlining the steps cut the onboarding time in half — improving both speed and employee experience.
These Value Stream Mapping examples show its versatility in all business functions.
Using Digital Tools for Value Stream Mapping
Today’s Lean teams use modern software to create and share VSM Maps digitally. Tools include:
Microsoft Visio – With Lean symbols and process templates
Miro – Collaborative whiteboarding for remote mapping
Lucidchart – Browser-based with drag-and-drop interface
SmartDraw / Edraw – Process-specific diagramming
eTWI.io – Designed to link VSM with work standards and instructions
These platforms support real-time collaboration and easy updates — ideal for Kaizen events or ongoing process reviews.
Value Stream Mapping Training: Building Team Capability
To apply VSM effectively, training is essential. VSM workshops teach teams how to:
Collect real data from the field
Use VSM symbols properly
Calculate takt time, lead time, and process time
Visualize waste
Develop Future State VSM maps
Integrate improvement actions with Kaizen plans
Hands-on training often includes real process mapping to ensure practical experience, not just theory.
Final Thoughts: Why VSM Matters
Value Stream Mapping is more than a Lean tool — it’s a mindset of seeing systems holistically and designing them to deliver maximum value with minimal waste.
Whether you’re in manufacturing, logistics, healthcare, IT, or service delivery, a VSM Map provides visibility, clarity, and alignment.
VSM enables:
- Faster decision-making
- Lower costs
- Happier customers
- More engaged employees
The first step to process improvement is seeing the truth.
The clearest way to see is through Value Stream Mapping.

I am a promoter of Lean Management and the Training Within Industry program. I am a practitioner. I co-create many startups. Since 2015, I have been the CEO of Leantrix - a leading Lean consulting company in Poland, which, starting from 2024, organizes one of the largest conferences dedicated to lean management in Poland - the Lean TWI Summit. Since 2019, I have been the CEO of Do Lean IT OU, a company registered in Estonia that creates the software etwi.io, used by dozens of manufacturing and service companies in Europe and the USA.