Implementing TPM across all machines at once would require the involvement of many people in the factory, which can be troublesome and impractical. This article presents how to select a pilot machine or a group of machines to ensure the successful implementation of TPM.
Implementation of TPM– Introduction
Industry is the fastest growing and most important branch of the economy. Manufacturing companies must constantly improve their production processes, among others, by making efficient use of their machinery. TPM addresses these challenges. Its main objective is to maximize the efficiency of machines by continuously increasing their availability, utilization, and the quality of the products manufactured.
Implementing TPM simultaneously on all machines would require the involvement of many people in the factory, which may be troublesome and impractical. Therefore, it is crucial to select a pilot area. Industry experience shows that companies select such areas based on various criteria. Table 1 summarizes the most common pilot areas chosen for TPM implementation in companies along with justifications for their selection.
Table 1. Most common criteria for selecting a pilot area for TPM implementation in manufacturing companies
| Selected pilot area | Justification for selection |
|---|---|
| Newest machine or group of machines | Implementation is relatively easy due to the lack of failures. Moreover, TPM can protect machines from breakdowns and help maintain them in optimal technical condition. |
| Oldest machine or group of machines | TPM can significantly improve the efficiency of older machines. |
| Most failure-prone machine | Implementing TPM on the most failure-prone machine enables quick and visible benefits, especially in the early stages of implementation. |
| Least utilized machine | Implementing TPM on the least utilized machine allows testing of solutions without affecting production. |
| Bottleneck machine | Implementing TPM on bottleneck machines improves their availability, which is critical for the overall efficiency of the production process. |
All the strategies for selecting a pilot area have logical justifications. Unfortunately, none of them comprehensively consider such criteria as: the role of the machine in the production system, its impact on delivery delays to customers, or its position in the value stream. This article presents how to select a pilot machine or group of machines for TPM implementation.
Criteria for Selecting a Pilot Area for TPM Implementation
In many factories, when several machines break down, it is difficult to determine which one the maintenance team should attend to first. In other words, there is no defined prioritization of machines. Employees intuitively feel which machine is the most critical. For operators, the critical machine may be the bottleneck that determines the efficiency of the production line. For maintenance staff, it is the machine that breaks down most often. For the finance department, it may be the machine used to produce goods for a key customer. Each group has a completely different perspective on the machines in the production process.
Therefore, it is essential to unify the approach and determine the priority of each machine. This helps not only in responding to failures but also in selecting machines or areas for TPM implementation.
To identify critical machines, three key criteria should be considered:
-
impact on the production system (X),
-
position in the value stream (Y),
-
impact on customers (Z).
TPM implementation should begin with the highest-priority machines. However, that is not all. Depending on the category of machine priority, an appropriate TPM strategy should be adopted—for example, regarding spare parts management or response time to identified defects.
Impact of a Machine on the Production System (X)
When analyzing the impact of machines on the production process, one should consider whether their downtime (e.g., due to breakdown) can stop production. The key in this analysis is to determine the utilization of machine capacity. This is calculated as the ratio of the average number of orders on a machine to its maximum throughput in a given time. Additionally, it is important to determine whether the machine has backup equipment, performance reserves, or alternative resources.
The results form the basis for assessing the machine’s impact on the production system (Table 2).
Table 2. Assessment key for machine impact on the production system (X)
Table 2. Assessment key for machine impact on the production system (X)
| Utilization of production capacity | Spare capacity available? | Description | Impact | Score |
|---|---|---|---|---|
| ≤ 75% | YES | Downtime has no impact on production | No disruption | 1 |
| > 75% ≤ 95% | YES | Downtime is offset by performance reserves | Very minor disruption | 2–3 |
| > 95% | YES | Downtime minimized using backup equipment | Minor disruption | 4–5 |
| ≤ 75% | NO | Downtime has small impact on production | Small disruption | 6–7 |
| > 75% ≤ 95% | NO | Longer downtime will cause significant production disruption | Moderate disruption | 8–9 |
| > 95% | NO | Even short downtime will cause severe disruption | Major disruption | 10 |
The higher the machine’s score in terms of its impact on the production system, the more disruptions its downtime generates for production.
Machine Position in the Value Stream (Y)
Not only the impact on the production system should matter when prioritizing machines. Equally important is the machine’s position in the value stream, and thus, the time allowed to fix its breakdown. The closer the machine is to the customer (downstream in the value stream), the shorter the time available for repair.
In practice, this means that the more work-in-progress inventory exists, the longer the time to fix a potential failure. However, it must be remembered that inventory is a form of waste. The machine’s position in the value stream is determined by comparing its repair time with the longest available repair time in the production system (Table 3).
Table 3. Assessment key for machine position in the value stream (Y)
| Share of repair time in the longest available system repair time | Example / Explanation | Impact | Score |
|---|---|---|---|
| ≥ 80% | No losses in time or quantity | Non-critical | 1 |
| < 80% ≥ 70% | No further impact on delivery date or performance | Low criticality | 2–3 |
| < 70% ≥ 50% | Rarely, delivery dates may be slightly exceeded | Medium criticality | 4–5 |
| < 50% ≥ 30% | Longer downtime may cause missed deadlines | Moderately critical | 6–7 |
| < 30% ≥ 10% | Likely to cause quantity losses or missed deadlines | Critical | 8–9 |
| < 10% | Significant impact on production output or delivery date | Highly critical | 10 |
The closer to the end of the value stream, the lower the percentage of repair time compared to the maximum available repair time in the system. Thus, the position becomes more critical.
Impact of Machine Downtime on Customers (Z)
The final criterion for machine prioritization is its impact on customers. If the customer can wait for a delayed product, the impact score is low. Such information can be gathered directly from the customer or from the sales department. Based on the data, the impact of machine downtime on customers is estimated (Table 4).
Table 4. Assessment key for the impact of machines on customers (Z)
| Customer impact of machine downtime | Example / Explanation | Impact | Score |
|---|---|---|---|
| ≤ 2 | Short delays have no impact on customers | None | 1 |
| > 2 ≤ 3 | Delays have no serious impact on customers | Very minor | 2–3 |
| > 3 ≤ 5 | Delays cause small interruptions for customers | Minor | 4–5 |
| > 5 ≤ 7 | Delays cause problems for customers | Moderate | 6–7 |
| > 7 ≤ 9 | Delays cause serious issues for customers | Major | 8–9 |
| > 9 | Delays stop customer production | Severe | 10 |
Defining a TPM Implementation Strategy
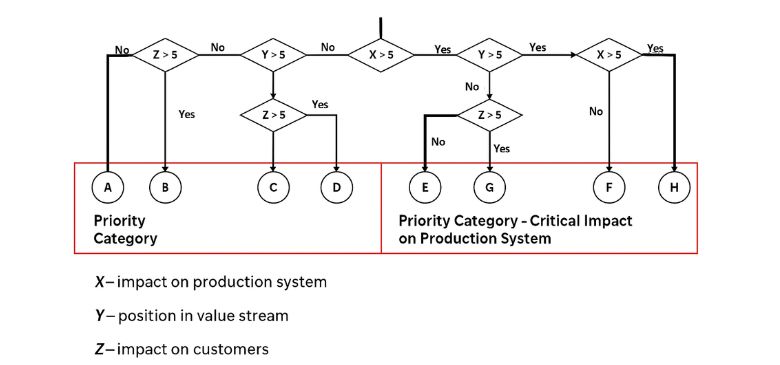
Fig. 1. Determining machine priority categories
The scores obtained from Tables 2, 3, and 4 should be used to determine the machine priority category, as illustrated in Figure 1.
TPM should primarily be implemented on critical machines (highest priority categories), marked as “F” and “H.” The next group should include machines categorized as “E” and “G.” The least critical machines—categories “D,” “B,” “C,” and “A”—may be targeted for TPM at the final stage.
Depending on the priority category of the machine, the TPM strategy should be defined accordingly (Table 5).
Table 5. Implementation of TPM strategy depending on machine priority category
| Priority category | Autonomous Maintenance – strategy | Planned Maintenance – strategy |
|---|---|---|
| Critical machines (H, F) | Daily inspections and maintenance; frequent audits of defect reporting system | Inspections or replacement of critical systems; detailed failure analysis; comprehensive repair plans; critical spare parts stored near machines; 24/7 maintenance resources; backup equipment available |
| Medium-critical machines (G, E) | Daily inspections and maintenance; defect reporting system checked once per day | Detailed repair plans for critical systems; spare parts stored near machines or in central warehouse; resources available for repairs |
| Low-critical machines (D, C, B, A) | Daily and weekly inspections | Minimize maintenance spending; extend maintenance intervals where possible; reduce spare parts costs; repairs performed during inspections |
The higher the machine’s priority category, the more detailed the planned and autonomous maintenance strategies should be. Spare parts should be stored as close to the machine as possible. Each machine failure should be thoroughly analyzed to define countermeasures preventing recurrence. Maintenance staff should be available at such machines throughout their working hours.
These machines should constitute the pilot area for TPM implementation in every manufacturing company. Maintenance staff should also attend to these machines first in the event of a failure.
Article information:
Published in Maintenance Services Magazine (May – June 2015)

I am a promoter of Lean Management and the Training Within Industry program. I am a practitioner. I co-create many startups. Since 2015, I have been the CEO of Leantrix - a leading Lean consulting company in Poland, which, starting from 2024, organizes one of the largest conferences dedicated to lean management in Poland - the Lean TWI Summit. Since 2019, I have been the CEO of Do Lean IT OU, a company registered in Estonia that creates the software etwi.io, used by dozens of manufacturing and service companies in Europe and the USA.